Wesleyan Media Project: Static Map
LIVE on Wesleyan Media Project Site
A first iteration of a longer project for the Wesleyan Media Project visualizing ad airing data across domestic United States for September 2018. A more detailed version and continuation of this project can be found on github.
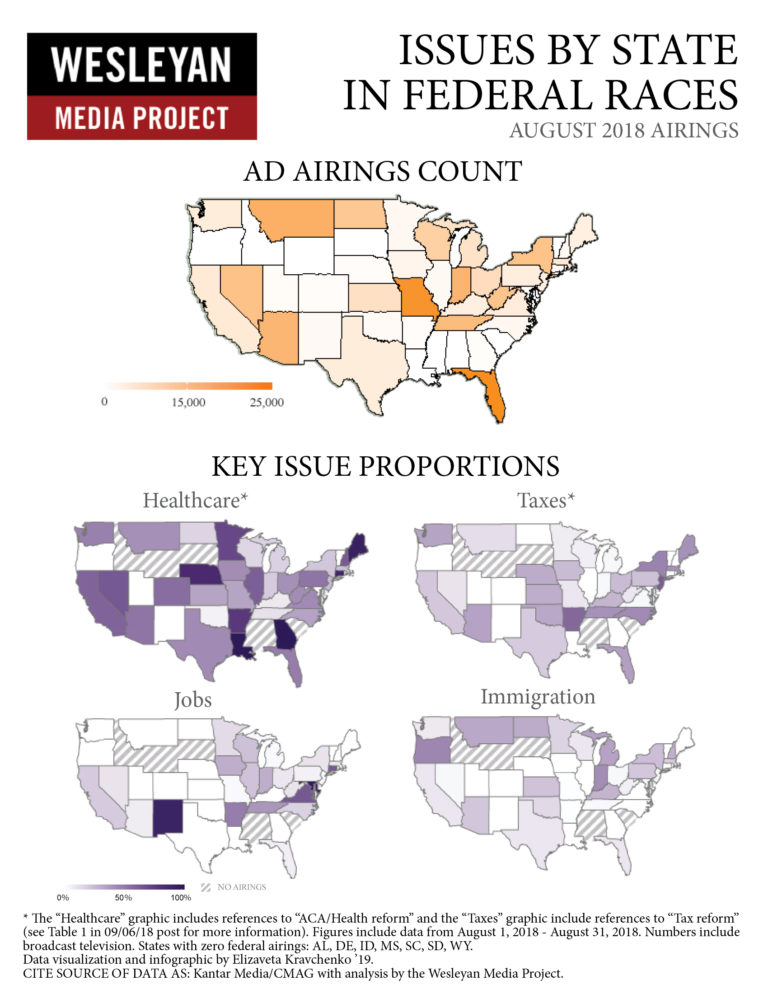
This visualization required more collaboration with the Project coordinators, leading to multiple drafts and layout iterations. The choropleths are coded in R (ggplot2), with layout in Adobe InDesign.